


Every week, someone on your leadership team asks a version of the same question: “Why is hiring taking so long?” or “What’s our real turnover rate?” or “Are we getting value from our recruitment spend?” The 5 HR metrics to track that answer these questions fast are time-to-hire, cost-per-hire, turnover rate, productivity, and engagement. Yet most HR teams track activity instead of results.
You scramble to pull numbers from different systems. By the time you have an answer, the moment has passed.
You know how many interviews happened last month. But do you know if your hiring process is actually getting faster? You see people leaving. But do you know if it’s a department problem, a manager problem, or a compensation problem?
The solution isn’t tracking more data it’s tracking the right data. Companies that focus on the five essential HR metrics to track don’t just answer leadership questions faster; they spot problems before they become expensive crises.
Deloitte’s 2025 Global Human Capital Trends report shows that leaders need new ways to measure the value of technology investments in HR. The report talks about using data and AI to shift focus from basic productivity to overall human performance. AI can help managers develop people by handling administrative tasks.
This guide breaks down the five most important HR metrics to track and shows you exactly how to measure them, what they reveal, and how to act on what you learn.
1. Time-to-Fill and Time-to-Hire
Let’s start with what every hiring manager cares about: speed.
Time-to-fill measures how long it takes from when you post a job until someone accepts an offer. Time-to-hire is the span from when someone first applies to when they say yes. They’re similar but different, and both matter.
Why? Slow hiring costs money. Your team works extra hours covering the open role. You miss project deadlines. Worse, top candidates get snatched by competitors while you’re still sorting through applications.
A company bringing someone on board in 30 days versus 90 days? That’s a massive difference in productivity and team morale. When you track these workforce metrics, you spot bottlenecks fast. Maybe interviews are taking too long. Maybe your approval process has too many layers. Once you know, you fix it.
How to track it: Log application dates and offer acceptance dates in your system. Calculate the average for each role and team. Compare month-to-month to spot trends.
Automated scheduling tools help here by reducing back-and-forth communication and streamlining the entire hiring pipeline so you hire without the typical delays.
2. Cost-Per-Hire:
You posted a job, ran ads, attended a job fair, and used a recruiter. What did it all cost?
Cost-per-hire is the total money spent on recruiting divided by the number of hires. Most companies have no clue what this number actually is. They just keep spending.
According to SHRM’s Talent Acquisition Benchmarking Report, the average cost to hire an employee in 2024 ranges from $4,000 to over $20,000, depending on the role and industry. For example, if you’re paying ₦800,000 per hire for a mid-level role, that’s a reasonable amount. If it climbs to ₦2.5 million, you need to look closer. And if you’re hitting ₦5 million for roles that don’t require it? You need to rethink your strategy fast.
The math is straightforward: job posting fees, advertising, recruiter commissions, internal HR time, interviews, and background checks add it up. Divide by hires. That’s your number.
Why track it? Because it directly affects your budget. As you grow, cost-per-hire either stays steady (good) or climbs (bad). When you see it climbing, you investigate. Maybe you’re hiring too many senior roles. Maybe your sourcing method is expensive. Once you see the pattern, you have data to make smarter decisions.
How to track it: Keep a spreadsheet (better yet, use HR software) that logs all recruitment costs. At the end of each quarter, do the math. Watch the trend over time.
AI-powered recruitment tools can cut cost-per-hire by automating talent sourcing, reducing manual screening time, and connecting you with pre-vetted professionals so you spend less time searching and more time interviewing real candidates.
3. Employee Turnover Rate
Your best developer just quit. You’re shocked. Looking back, maybe you shouldn’t have been.
Employee turnover rate is one of the most revealing HR metrics to track because it tells a story about your company culture, management quality, and compensation competitiveness. It measures the percentage of employees who leave your company in a given period.
The U.S. Bureau of Labor Statistics reports that voluntary turnover rates averaged 13% in 2024-2025, though this varies significantly by industry. A turnover rate of 5% is excellent. 10% is manageable. 20% means you have serious problems.
Here’s why this matters: replacing someone costs roughly 50-200% of their salary, depending on their role. A senior engineer leaving? That might cost you $200,000 to replace when you factor in recruitment, training, and lost productivity.
Turnover isn’t random. It tells a story. High turnover in one team means something’s wrong with that manager. High turnover in your first 90 days means your onboarding process needs immediate improvement. High turnover across the board? Your culture or pay might be the issue.
The key is to track turnover by department, tenure, and role. That tells you where to focus. Sometimes you’re losing people to competitors. Sometimes people aren’t getting the growth they need. Sometimes it’s pure burnout.
How to track it: Count how many people left this month. Divide by your average headcount. Track this monthly and quarterly. Watch for patterns by team or role.
Strong employee retention strategies, like better onboarding, clear performance tracking, and regular feedback, help teams stay engaged. As a result, managers can spot issues early and fix them before good employees choose to leave.
4. Productivity and Performance:
Here’s the uncomfortable truth: most companies don’t know if their people are actually productive.
The HR metrics used to track productivity often depend on each role. For example, they can include sales closed, customer satisfaction scores, projects finished on time, quality of work, and peer feedback. In addition, Harvard Business Review, performance reviews matter less than real, ongoing data.
Why? Because it lets you spot problems early. If someone’s productivity drops 30%, that’s a signal. Maybe they’re overwhelmed. Maybe they’re looking for another job. Maybe they need training. You’ll never know if you only review performance once a year at review time.
Consistent measurement also helps you identify your top performers. Who should you promote? Whose methods should the team copy? Data answers these questions.
How to track it: Use your systems to log KPIs relevant to each role. Some metrics are automatic (sales numbers). Some require check-ins and feedback. Trending the data over time monthly is better than annually.
Performance management tools with real-time feedback systems and dashboards show you who’s performing well and where coaching is needed.
5. Workforce Retention and Engagement:
Okay, you kept your employees. Now, are they actually engaged?
An engaged employee stays longer, produces better work, and helps you attract talent. A disengaged employee? They’re already halfway out the door, even if they haven’t quit yet.
Gallup research shows that engaged employees are 21% more productive and significantly less likely to leave. Engagement metrics include things like: internal promotion rate, training hours completed, employee survey scores, and voluntary turnover (as opposed to forced departures). These tell you whether people believe in your company and want to grow there.
Here’s what many HR teams miss: you can have low turnover but high disengagement. People stick around because they need the paycheck, but they’re not committed. That shows up in quality, morale, and eventually, they leave anyway.
Retention rate is the flip side of turnover, the percentage of people who stay. Track this alongside engagement data, and you get a full picture. Are people staying because they’re happy, or because they can’t find other jobs? That distinction matters.
How to track it: Measure how many people make internal moves or get promoted. Run pulse surveys quarterly ask simple questions about job satisfaction, growth opportunities, and whether they’d recommend the company. Track exit interview feedback. Look for patterns.
Employee development tools and clear career pathways help leaders stay connected to their teams and spot issues before they become problems.
How to Use These HR Metrics to Track Performance
You could track all five of these HR metrics to track and still make bad decisions. Here’s what matters:
Pick 2-3 metrics to start. You don’t need complexity on day one. Master the basics first.
Set a baseline. If your cost-per-hire is $8,000 right now, that’s your starting point. Your goal isn’t to hit some industry benchmark, it’s to improve your own number over time.
Review your metrics monthly with your team. Not quarterly. Monthly. The faster you spot trends, the faster you can act. If time-to-fill suddenly jumps, investigate immediately. Don’t wait three months.
Share the data with your team, especially managers. When hiring managers see that a certain role takes 60 days to fill, they start thinking differently about retention. When they see turnover in their team is 15%, they get serious about culture. Data drives behavior.
Starting Your Analytics Journey
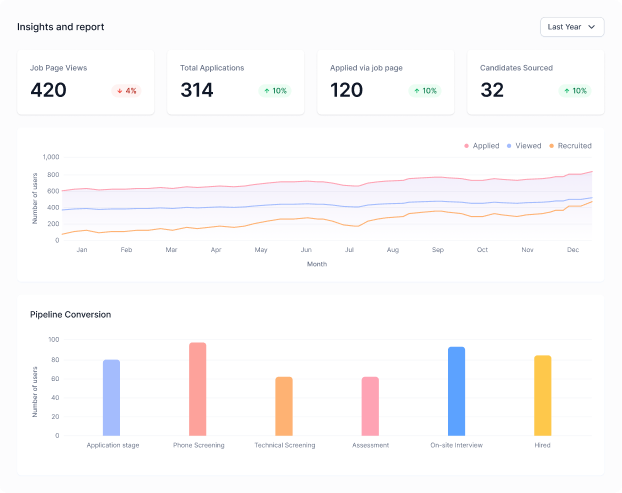
You don’t need fancy software to get started. A spreadsheet works. But honestly? Once you start tracking multiple metrics, a dedicated HR platform makes life a thousand times easier. You’re not manually calculating anything. Real-time dashboards show you what’s happening today, not three weeks ago.
These HR metrics to track aren’t about perfect data; they’re about better data. The small improvementsshaving 10 days off your hiring process, reducing turnover by 3%, cutting cost-per-hire by 15% they compound fast.
Start tracking these metrics this week. In three months, you’ll have insights you don’t have today. In six months, you’ll be making better decisions. That’s where the real value lives.
Conclusion
Ready to put these analytics into practice? Loubby AI gives you integrated recruitment, onboarding, and workforce management tools that automatically track these metrics for you. No spreadsheets. No guesswork. Just real data that helps you build stronger teams faster. Schedule a demo today and see how it works.
For more insights on building better HR systems, explore our comprehensive guide on how startups can build strong teams on a budget.